Art Bot Walkthrough 2: Failures at Refinement
Bradley Momberger • •
0: the refresher
Last time we went through the process of prototyping an approximation of random Mondrian paintings. Using randomly spaced vertical lines and randomly spaced horizontal dividers, we got a close approximation. For reference, here’s another example of the process in action.
Now we have an issue to work through, in that a real Mondrian isn’t perfectly divided along the vertical lines. Let’s try to account for that. One possibility is to forgo the line drawing, and instead focus exclusively on drawing the rectangles.
1: Reimagining the paint process
First we’ll define a grid by making yparts the same as xparts.
var yparts = [];
while(asum(yparts) < 512) {
  yparts.push(Math.floor(Math.pow(Math.random() * 14, 2)) + 50);
}
Now we have a set of xparts (vertical lines) and a set of yparts (horizontal lines). The fills will now be changed so that every single grid item is a rectangle, either white or a primary-ish color.
var fills = [];
xparts.forEach(function() {
  fills.unshift([]);
  yparts.forEach(function() {
    fills[0].push("rgb(255, 255, 255)");
  });
});
var count = Math.floor(
  Math.random() * xparts.length * yparts.length / 2
) + 1;
var fillcolors = ["rgb(255, 255, 0)", "rgb(255, 0, 0)", "rgb(0, 0, 255)"];
var xp, yp, fill;
while(count--) {

  xp = Math.floor(Math.random() * xparts.length);
  yp = Math.floor(Math.random() * yparts.length);
  fill = fillcolors[Math.floor(Math.random() * fillcolors.length)];

  fills[xp][yp] = fill;
}
And our fills are now a bit simpler with the addition of a second forEach() call.
fills.forEach(function(xfills, i) {
  xfills.forEach(function(xyfill, j) {
    var xoff, yoff, w, h;

    context.fillStyle = xyfill;
    xoff = i && asum(xparts.slice(0, i)) + 7;
    yoff = j && asum(yparts.slice(0, j)) + 7;
    w = xparts[i] - (xoff ? 7 : 0);
    h = yparts[j] - (yoff ? 7 : 0);

    context.fillRect(xoff, yoff, w, h);
  });
});
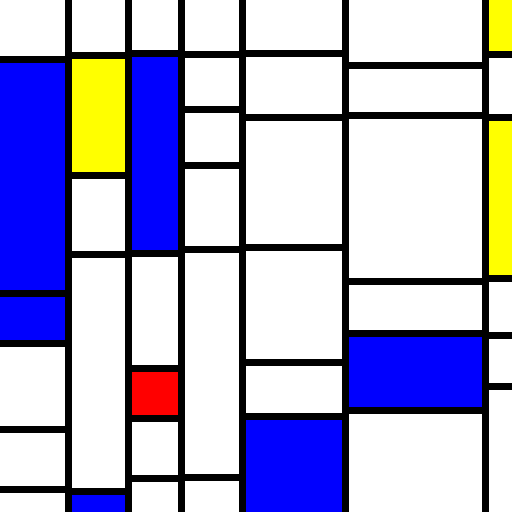
And some sample output:
Now we’re looking at just a straight grid (horizontal and vertical lines both going full width/height), but otherwise it’s similar to our previous exercise. Here’s where it can be a bit more interesting, though; instead of introducing jitter within the grid by line offsets, let’s combine some of the blocks to the left and top.
2: Degridifying
Going back to how we defined fills, we have this line:
var fillcolors = ["rgb(255, 255, 0)", "rgb(255, 0, 0)", "rgb(0, 0, 255)"];
To this we can add, say “left” and “top”, which we’ll use when drawing fills to just continue the fill from the left or from above, except when we’re already at the left or top margin.
var fillcolors = [
  "rgb(255, 255, 0)", "rgb(255, 0, 0)", "rgb(0, 0, 255)",
  "left", "left", "left", "top", "top", "top"];
var xp, yp, fill;
while(count--) {

  xp = Math.floor(Math.random() * xparts.length);
  yp = Math.floor(Math.random() * yparts.length);
  fill = fillcolors[
           Math.floor(
             Math.random()
              * (xp * yp === 0 ? 3 : fillcolors.length)
            )
         ];

  fills[xp][yp] = fill;
}
And now we change the fill drawing to look like this:
fills.forEach(function(xfills, i) {
  xfills.forEach(function(xyfill, j) {
    var xoff, yoff, w, h;
    var offsetTop = j !== 0 && xyfill !== "top";
    var offsetLeft = i !== 0 && xyfill !== "left";

    if(xyfill === "left") {
      context.fillStyle = fills[i - 1][j];
    } else if(xyfill === "top") {
      //reuse last fill style
    } else {
      context.fillStyle = xyfill;
    }

    xoff = asum(xparts.slice(0, i)) + (offsetLeft ? 7 : 0);
    yoff = asum(yparts.slice(0, j)) + (offsetTop ? 7 : 0);
    w = xparts[i] - (offsetLeft ? 7 : 0);
    h = yparts[j] - (offsetTop ? 7 : 0);

    context.fillRect(xoff, yoff, w, h);
  });
});
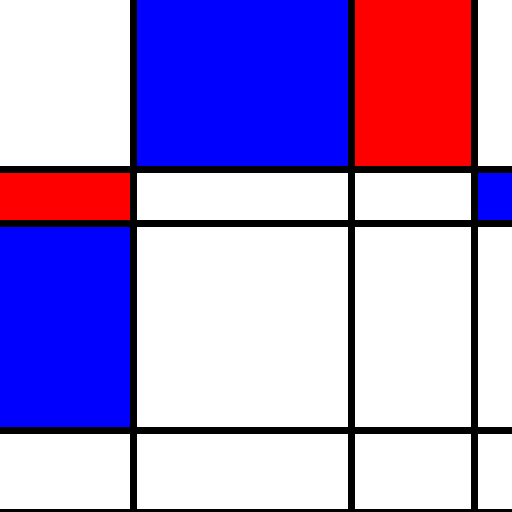
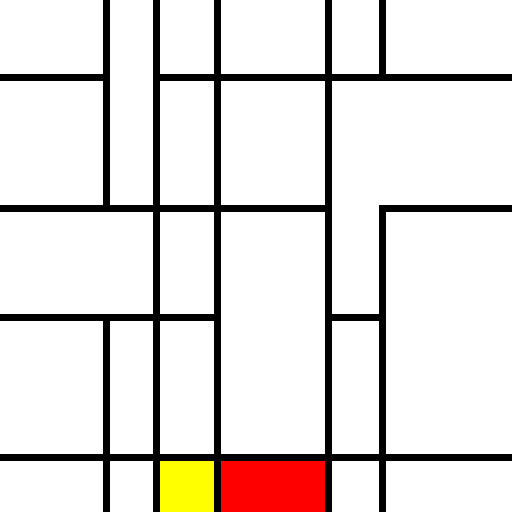
The major bit here is that we’ve now stopped using the offsets as the determinant for whether the grid cell should be offset by 7px (to show a black divider), and instead base it on whether the index is zero in one dimension or whether the fill style is “left” or “top”. So running this a few times so it’s illustrative (a problem soon to be addressed here), we get this output.
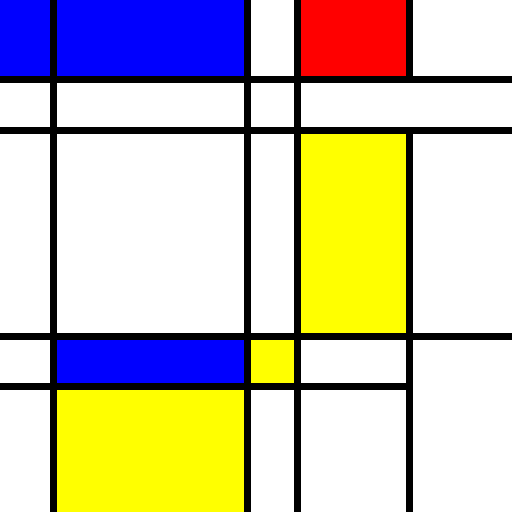
But we also get sample output looking like this.
This indicates that we need to tweak the randomizer somewhat so that it looks a little bit less mechanical.
3: Failed improvements
The rest of this post, as indicated by the title, is reserved for things which didn’t really work as expected.
3.1: More randomizer
var count = Math.floor(
  Math.random() * xparts.length * yparts.length * (1 - 1 / Math.E)
) + 4;
for the number of backtracking or colored fills makes for not much more interesting things. The count could be as little as 4 if the randomizer comes out small. A normal or poisson distribution with sqrt(xparts.length * yparts.length) * C + C for arbitrary constants C as the mean would likely be better in this case.
3.2: Backtracking over rows and columns
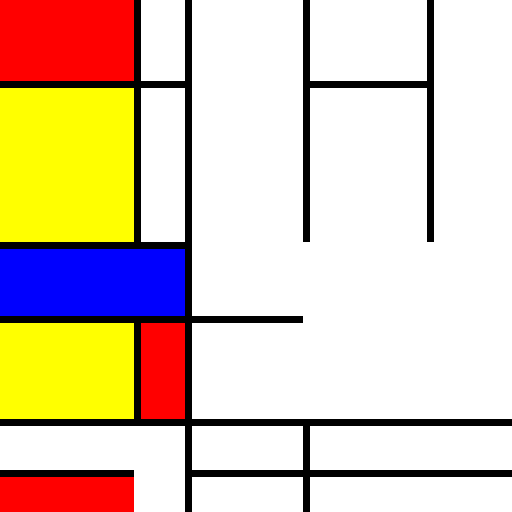
Sometimes if “left” and “top” are put in at just the right place, the result is a non-rectangular area where a top and a left extension are too close together.
To address this, I tried backtracking over every “left” and “top” cell until reaching something that was neither, eliminating the 7px left offset if a left was found, and the 7px top offset when a top was found. This changed the fill routine to the below.
fills.forEach(function(xfills, i) {
  xfills.forEach(function(xyfill, j) {
    var xoff, yoff, w, h, ref_i = i, ref_j = j;
    var offsetTop = j !== 0;
    var offsetLeft = i !== 0;

    while(xyfill === "left" || xyfill === "top") {
      if(xyfill === "left") {
        offsetLeft = false;
        xyfill = fills[ref_i -= 1][ref_j];
      }
      if(xyfill === "top") {
        offsetTop = false;
        xyfill = fills[ref_i][ref_j -= 1];
      }
    }
    context.fillStyle = xyfill;

    xoff = asum(xparts.slice(0, i)) + (offsetLeft ? 7 : 0);
    yoff = asum(yparts.slice(0, j)) + (offsetTop ? 7 : 0);
    w = xparts[i] - (offsetLeft ? 7 : 0);
    h = yparts[j] - (offsetTop ? 7 : 0);

    context.fillRect(xoff, yoff, w, h);
  });
});
This has an unexpected side effect, though.
Still, it’s important to the final product that we are able to split up the lines with blocks spanning multiple columns. Another strategy is required here.
3.3: Second attempt at backtracking.
After some thought, incompletely bounded rectangles in part 3.2 was fairly easy to work out. Backtracking is still the method used in the code below, but instead of just drawing the current cell, we redraw the original top-left cell for the backtrack chain to be the width and height of all the blocks backtracked over.
fills.forEach(function(xfills, i) {
  xfills.forEach(function(xyfill, j) {
    var xoff = asum(xparts.slice(0, i)),
        yoff = asum(yparts.slice(0, j)),
        w = xparts[i],
        h = yparts[j], ref_i = i, ref_j = j;

    while(xyfill === "left" || xyfill === "top") {
      if(xyfill === "left") {
        xyfill = fills[ref_i -= 1][ref_j];
        xoff -= xparts[ref_i];
        w += xparts[ref_i];
      }
      if(xyfill === "top") {
        xyfill = fills[ref_i][ref_j -= 1];
        yoff -= yparts[ref_j];
        h += yparts[ref_j];
      }
    }
    context.fillStyle = xyfill;

    xoff += (ref_i ? 7 : 0);
    yoff += (ref_j ? 7 : 0);
    w -= (ref_i ? 7 : 0);
    h -= (ref_j ? 7 : 0);

    context.fillRect(xoff, yoff, w, h);
  });
});
But we have a problem now. Here’s a table showing the 2d “fills” from a run of the script, transposed so that x-fills read across and y-fills read down.
| rgb(255, 0, 0) | rgb(255, 255, 0) | rgb(255, 255, 255) | rgb(255, 255, 255) |
| rgb(0, 0, 255) | rgb(255, 255, 255) | rgb(255, 255, 255) | left |
| rgb(0, 0, 255) | rgb(255, 255, 255) | rgb(255, 255, 255) | rgb(255, 255, 255) |
| rgb(255, 255, 255) | left | top | left |
| rgb(255, 255, 255) | left | top | top |
| rgb(255, 0, 0) | rgb(255, 255, 255) | top | rgb(255, 255, 255) |
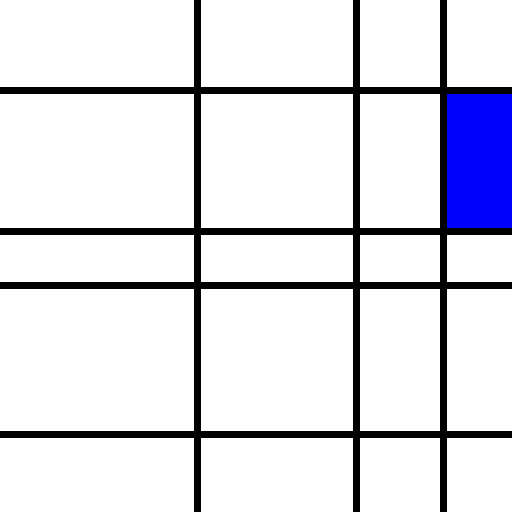
In the bottom right corner, a “top” in the bottom row and a “left” in the last column both wind up to the bolded cell at (2, 2), creating overlapping white rectangles. The output is predictably non-rectangular.
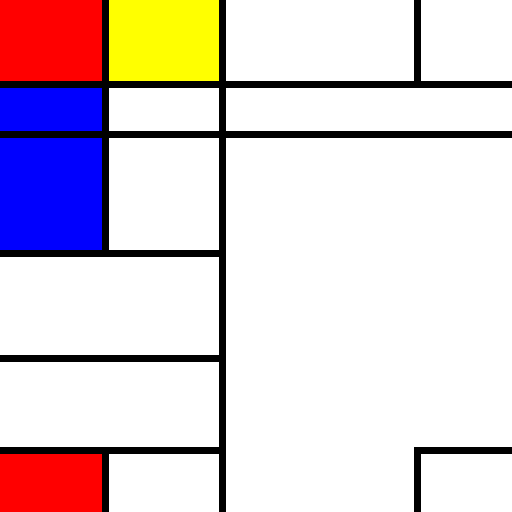
It seems we’ll have to try a different strategy for crossing row and column boundaries in our fill drawing. To prevent the problem of multiple rectangles spanning from the same source, the source will have to be responsible for determining its row and column span. This will be covered in the next post.